21 November 2024

Game Hacking: Part Deux


I'm still playing through the Assassin's Creed franchise. But now I've finished Rogue and have moved on to Unity which--although released on the same day--are (console) generations apart. However, this also means that the games were created with different Ubisoft game engines: AC:Rogue was the last game on AnvilNext and AC:Unity was the first game on AnvilNext 2.0.

Different engines ostensibly have different issues, and older engines can have issues on newer hardware. My previous post describes my issues with AC:Rogue where the game would stall for seconds at a time with too many CPUs. And I run an AMD Threadripper 5975W with 32 cores/64 hyperthreads--difficult hardware to come by 10-12 years ago when these engines were created.

Turns out that AC:Unity also has problems with too many CPUs--it crashes to desktop immediately after launch!

Has this already been fixed?

The first step was to see if anyone else has run into this problem and if they've fixed it. Turns out I was in luck. A reddit user running on the same CPU had the same issue. Unfortunately, the workaround was pretty sucky--disable CPU cores in the BIOS. I definitely don't want to have to reboot before and after playing the game.

Fortunately now we know what the problem is--too many CPUs. The fix in the previous blog post was similar, but since this is the second game I've had to fix in the same way, let's see if we can make a fix that is more generic.

Let's make a generic tool! But how?

Enter Microsoft Detours--an amazing tool for hacking (and even some legitimate uses). Basically the plan is to create a .DLL file that we can inject into the process that will intercept (or hook) some system calls and lie present an alternative set of facts to the game. This .DLL can be used with nearly any game, so we could go back and use it with Rogue to fix it without hacking the assembly language.

In the previous post, we pointed out two system calls (GetSystemInfo and GetNativeSystemInfo) that tell us the number of CPUs, but this is just the tip of the iceberg. It turns out that AC:Unity uses many more system calls than this. And for our generic tool to support all games, we should at least figure out what AC:Unity is using and support those calls.

But where do we draw the line? In the past 20+ years we have gone from single CPU to multiple SMP CPUs, to NUMA. Machines are available these days that have over 64 CPUs. AMD is preparing to launch servers with 256 cores next year (order now!). Now it's unlikely people will run games on these machines, but that was probably the thinking back when 32+ CPU machines were unheard-of. The point is that modern Operating Systems have evolved and added system calls to support NUMA, CPU Groups and CPU Sets. While it's conceivable that games could call some or all of these, let's assume that they won't. But maybe we can set up some logging for these functions to see if they're ever called.

The bigger issue is probably going to be affinity. Simply put, affinity is a list of CPUs that a process (or threads) can run on. Typically this list is given as a bit mask since each bit can effectively represent a CPU. Since (historically) the number of CPUs was small, this was fine for a 32-bit value, but now we have over 32 CPUs! No longer can a single 32-bit value represent an affinity mask. Older 32-bit applications typically used a 32-bit value, but newer 64-bit applications generally use 64 bits (but bugs may exist from porting previous code, etc.).

Intercepting Functions

The Detours wiki has a pretty simple minimum example for hooking instrumenting the Sleep function. Let's alter it for GetSystemInfo, one of the functions that we'll need to intercept. (Source Listing)

This listing will compile into a .DLL that, when loaded by an application, will override calls to GetSystemInfo and allow us to alter the responses.

Once DetourTransactionCommit() is called in our InstallDetours() function our hook is in place:

Now whenever GetSystemInfo is called, our version is called instead. We just happen to call the original and then modify the number of processors:

The next step is that we need to get the game to load our new DLL. Unfortunately, this is easier said than done. Games these days typically don't want hackers messing with them and they go to great lengths to try to prevent that (just as I did when working on my games). AC:Rogue didn't have any protections, but AC:Unity has a multiplayer element to it, and multiplayer games typically make attempts to curb hacking/cheating. Now I'm just trying to get the game to run but it doesn't know that.

Detours has (at least) two tools that can be used. The WithDll tool can be used to launch an application and inject a DLL before it fully loads. Unfortunately this method didn't work with AC:Unity because of how it's launched. I purchased the game through Steam, so Steam launches AC:Unity, which sees that it wasn't launched from Ubisoft Connect, so it launches Ubisoft Connect and exits, which does a few things (cloud sync for instance) and then re-launches AC:Unity. Since I cannot control how the game is launched from Ubisoft Connect, this didn't pan out. Interestingly though the app did launch with the injected DLL.

The other tool is SetDll. This tool can modify an executable file to always load a new DLL. This sounds like exactly what we need! Unfortunately, this didn't work either since AC:Unity has hack-prevention checks that noticed that the executable was modified and refused to run.

Frustrated, I started looking in to other ways to inject the DLL. SetDll works on DLLs too, so if I can catch it early enough in the loading process, I could use a different DLL as an injection vector. I fired up Process Monitor and fiddled with the filters to see what the AC:Unity process was doing when it started. Turns out it ships with a DLL that is loaded very early, and that DLL doesn't complain about modifications. Eureka! I have my injection vector.

I added some simple logging (using OutputDebugString that I could view with the DebugView utility) to my simple example to make sure that my function was being called (since AC:Unity also detects debuggers and terminates the process if one is found). Good news--it was being called! But of course, the game was still crashing. So while this was enough to essentially fix AC:Rogue, the newer engine does different things and will need more work.

Affinity Functions

As I mentioned above, the functions that control affinity are probably in use. The Microsoft article about Processor Groups has a good list of functions that control affinity and scheduling. My process was to first add logging for these functions to see if they were being called. The logging would include what arguments that AC:Unity was passing to the functions as well as what the functions returned. Turns out that several of them were being called. Even though GetSystemInfo (and GetNativeSystemInfo) were intercepted and showing a lower number of CPUs, the affinity functions were happily reporting affinity across a larger number of CPUs.

The next process was to change the behavior of these affinity functions to only return bits set for the number of processors that we were emulating.

An interesting function that it turns out AC:Unity was also calling is SetThreadIdealProcessor (and the extended version). This function gives the Windows scheduler a hint about which CPU to schedule the thread on, but it's not as strong as affinity. I also intercepted this function to only allow the processors in our emulated set.

Logical Processor Info

In my work hacking AC:Rogue I discovered that it was optionally looking for and calling a function called GetLogicalProcessorInformation (which also has an extended version). CPUs these days are very complicated: they have multiple layers of caching (some of which are shared with other cores), can share hyperthreads with other cores, not to mention the NUMA relationships. These functions are the means to access this data on Windows, and as you might expect, are quite complicated. The extended version is even more complicated allowing different means of querying data and returning variable-sized information.

It turns out that AC:Unity was also calling these functions, so they are another one that I had to wrangle.

For the original function, all of the data is presented at the same time, so the function returns the same data every time it is called (at least, it is highly unlikely that it would change while the game is running). Therefore, it is easily cached. The first time my intercepted function is called, it queries all of the host data, chops it down to only include our emulated processors, and saves it off so that every subsequent time that we're called we just return the same data.

Unfortunately, the extended function allows specifying a Relationship Type to query, and the data is drastically different based on that query type. My solution here was to cache the chopped-down host data and remember the Relationship Type along with it. So if a different Relationship Type was queried I would throw away the cache and rebuild it. This however was much more complicated because of the variable-sized data. I essentially had to filter the data in place and then copy the filtered data into the cache. For this it's probably better to look at the code directly: (intercept function, cache builder)

Does it run now?

YES! 🎉

In the end, I ended up hooking 12 functions (but three--the Process Group functions--weren't called by AC:Unity and therefore only log).


Finally, I can play the game for a bit.

But... oh no. There's another problem.

The Video Problem

I have a Samsung Odyssey G9 49" monitor. It's aspect ratio is 32:9 and I'm playing a game originally designed to run on consoles that output 16:9. However, the PC port of the game itself beautifully figures out the correct aspect and does pretty well with the super ultrawide display, as evidenced in the screenshot at the top of this post.

The problem is the full-motion videos that it uses for cutscenes. They are originally designed for 16:9 and are stretched out to 32:9--double the width they should be. It's almost breaking my brain trying to watch them and figure out what's going on.

A very wide Mr. Templar tied to a tree

Can I fix this too?

Bink Video

Bink is a popular video encoder and player software package for games. Developed by RAD Game Tools (now owned by Epic and rechristened as Epic Game Tools), Bink was originally released way back in 1999.

Bink is pretty easy to integrate and very fast. I integrated it in to EverQuest 2 back in 2006, so I'm somewhat familiar with the API.

Turns out that Ubisoft uses it in AC:Unity, though a much newer version than the one I used. Fortunately a lot of the API seems to have remained consistent. And all I want to do is prevent the videos from being stretched.

Research

The first step is to figure out how AC:Unity is using Bink. Fortunately I already have the means to do this, just like I did with the CPU Windows system functions--hook the API calls and see how they're being called. Bink is loaded as a DLL, so theoretically I can hook it too.

And the initial tests are promising. I used Microsoft's dumpbin tool to list the exports from the Bink DLL. Pretty much any application is guaranteed to call BinkOpen, so that's the first function that I hook. And testing is quite quick since the first thing AC:Unity shows is the Ubisoft logo video.

Unfortunately, this is where things hit a snag. I've managed to hook a few functions that give me useful information (I can see BinkRegisterFrameBuffers called for instance), but none of the functions with names that sound promising are ever called (BinkCopyToBuffer, BinkCopyToBufferRect, BinkBufferOpen, BinkBufferSetResolution, BinkBufferSetScale). I ended up hooking 20+ of the most interesting sounding functions only to see a tiny few of them being called. How is it accessing the data without calling BinkCopyToBuffer?!?

It's time to get dirty. I can't attach a debugger because of the anti-hack measures (and it will take way too long to reverse engineer those), but I need to see it in a debugger when it's trying to access the data. So I'll make the game hang when it tries to access the framebuffer!

It turns out this isn't too complicated: I register an unhandled exception filter that just sleeps infinitely when a crash happens, and then I call VirtualProtect to tell Windows to make the framebuffer data no-access--any attempt to read or write to it will cause a crash. However, I have to allow Bink to write the data in to the framebuffer, I just want to see where it's read back out, so I have to allow access to the BinkDoFrame function.

As soon as the game hangs (without displaying the first video frame) I use Task Manager to write a full dump. But the dump is confusing. I have no symbols, no function names, nothing to really give me any clues as to what's happening except the assembly code. And it looks like AC:Unity is reading the data directly out of the framebuffers.

That's exactly what it's doing. AC:Unity is calling BinkRegisterFrameBuffers which means it is allocating its own framebuffers and undoubtedly retaining the pointers. BinkDoFrame will decompress the video stream into the framebuffer, and then AC:Unity is reading the data (probably with a shader) to display on the screen.

The video fix

Looking at the allocated framebuffers, they're 1920 x 1080 (16:9 ratio) and their shaders are probably the stretching culprit. I'm not a GPU/graphics guy (ironic given where I work) and I have no idea how to break into the game's shader pipeline. It can be done because there are other mods out there that do, but it will take a long time to learn how to do this. And I want to get back to playing the game, so how do I do it quickly? Is there something I can do to the framebuffers?

It turns out I can! I need AC:Unity to allocate 32:9 framebuffers instead of 16:9, and the first two values in the structure returned from BinkOpen looks like width and height. So the first thing I try is just scaling that width to 32:9. Since buffers historically were powers of two, they typically have a pitch passed to the decoder that says how many bytes represent a line so that it can skip to the start of the next line (extra bytes would just be off the screen). This helps us out here since the pitch tells Bink to skip about half of the line and just start decoding on the next line. It works!

Better?

Well, kinda. Why is half of the screen green? Hey, but at least the aspect ratio is correct. And it's not centered, but we can fix that too (probably).

Alright, so the green screen. Encoding video data as RGB is very inefficient. Remember, Bink is a library developed in 1999 and first used on the PlayStation. It uses the YCrCb color space for its video information to use less space. AC:Unity likely has a pixel shader that computes the RGB values from the YCrCb planes that the framebuffers are allocated from. The buffers started with zeroed bytes and since the right half of the screen is never written to by the decoder, they remain as zeroed bytes. Well converting the zero values for YCrCb ends up with RGB color #008700, a quite greenish hue.

Looking up the value for black in YCrCb and setting the initial state of the buffers to those values gives us a dark gray. Not quite black. But that link has the minimum Y value as 16, which gives us a dark gray, but trying a Y value of 0 gives us black.

So the last issue to tackle is the centering. AC:Unity has given Bink the addresses for the framebuffers by calling BinkRegisterFrameBuffers. Bink decodes data into the first line at the start of the buffer, advances the line pointer by pitch bytes and decodes the next line, so on and so forth. If we can tell it to use a different starting address for the buffer that represents a centered frame, it will move the whole image.

This is pretty easily done, we can just calculate the scaled width of our screen, subtract the width of the video and divide by two to get the framebuffer line offset. We have to do this for each plane separately because the Cr and Cb planes are smaller than the Y/A planes. The tricky thing here though is that Bink requires the framebuffer address to be 16-byte aligned, otherwise a hang occurs in the decoder (speaking from experience).

Voila!

Not so wide now, Mr. Templar!

Source is here. Uploaded to NexusMods and now back to playing the game!


09 October 2024

Game Hacking


I've been playing through the Assassin's Creed franchise in anticipation of Shadows due out later this year, or well, now pushed to early next year. I really enjoyed Assassin's Creed IV: Black Flag, but ran into an issue that some other people had too: Kenway's Fleet wouldn't load. Fortunately, someone created a patch that fixed it, and additionally made initial connection to Ubisoft much faster.

Fast forward a bit and I'm playing Assassin's Creed: Rogue, which is a great game in its own right, but borrows a lot from Black Flag. However, I started running into an issue: five (or more) second stalls where the game would just freeze (audio would keep playing) and then resume as if nothing happened. I could go a minute or so without these freezes, but sometimes it would be only a second or two after the previous freeze. It was nigh unplayable.

Searching around, other people didn't seem to report the same problems that I did. But my PC is pretty unique: it's an AMD Threadripper with 64 logical cores and 128 GB of RAM. That's a lot of hardware for a game released 10 years ago. Looking in Task Manager, I see that the game has about 280 threads. That's a lot! I wondered if the game is creating a number of worker threads per logical CPU, but perhaps isn't optimized for such a high number of CPUs. Designing software that runs well fully using 4 CPUs is a lot different than software that fully uses 64 CPUs.

Alright, so my working theory: the game has a contention problem that shows up with tons of threads.

How to test that theory? I fire up one of my favorite profilers: Superluminal. Unfortunately, my ability to seriously debug performance issues is going to be hampered by the fact that I don't have any debugging information (or source code) for the game in question. But Superluminal can tell me what the OS is doing, and what requests the game is making of the OS.

So I fire up Superluminal and tell it to start watching "ACC.exe", the AC:Rogue executable. Sure enough, within a few seconds I get a 5 second stall. After it recovers, I head back to superluminal to stop the tracing and start looking at it. The stall is clear as day and I have selected it here:


From this, it's pretty apparent that the main thread is running hard during the stall, and from the function list in the bottom-left corner, I see it's trying to lock and unlock "critical sections" which are Windows mutex-like objects. Note that before and after the stall the main thread spends a decent amount of time synchronizing (the red part of the red/green CPU activity graph). Let's scroll through the other threads and see if we see anything else interesting.


Aha! Thread 86036 has a CPU chart that is all blue. This is Superluminal's visual language for "preemption" that is, the thread was running but the Windows scheduler decided that running something else was more important. Also interesting to note that the other worker threads above are completely blocked on synchronization. They're just waiting during this stall.

Looking through some of the other threads there's not really much that is interesting. A few threads are sleeping and waking up periodically. But the main thread is running hard, this thread 86036 is preempted, and pretty much everything else stops while this is happening. It's possible that Windows  (for some unknown reason) chooses to stop running this thread 86036 and instead runs the main thread.

Superluminal gets information about every process running on the system at that time, and the only thing using any CPU is ACC.exe, the game we're profiling.

For additional information, I also captured system state using Event Tracing for Windows by utilizing the UIforETW tool by Bruce Dawson. Looking at the capture I was able to find a different stall in the same thread:


Check out the highlighted line: the thread was ready to run for 4,747,081.6 microseconds (4.7 seconds!) before it ran, and the Readying Thread of -1 indicates that it was in fact preemption. Not immediately apparent from the screenshot (but from further digging through the UI) is that both the main thread and thread 86036 have the same Ideal CPU (0) and Priority (15)

Unfortunately it's still not super apparent exactly what is causing this. A possibility is affinity--which CPUs a thread is allowed to run on--but it's not clear how to check this. Most threads have 0 as their Ideal CPU, so I'm not sure that this value is actually used by Windows 11. But the Priority values are interesting. Most of the threads in the process have Priority values of 13 and 15, which would correspond to a "High" priority class and "normal" and "time critical" priorities respectively. If both the main thread and thread 86036 share a "time critical" priority, they could affect each other running.

But my initial thought was that 280+ threads is a lot, especially if it's running some or all of them as time-critical priority. Let's see if we can get the game to create fewer threads. Unfortunately, this is easier said than done.

Most compute-intensive programs trying to max-out a machine (like games) will typically create at least one thread per CPU, so maybe we can lie to the game about how many CPUs there are. There are actually several API calls that it could be making to determine this, but the most common one would be GetSystemInfo (side note: modern C++ Runtime implementations use GetNativeSystemInfo, but this function does not appear to be used by ACC.exe). Fortunately the game executable doesn't appear to be cryptographically signed, so we should be able to patch it.

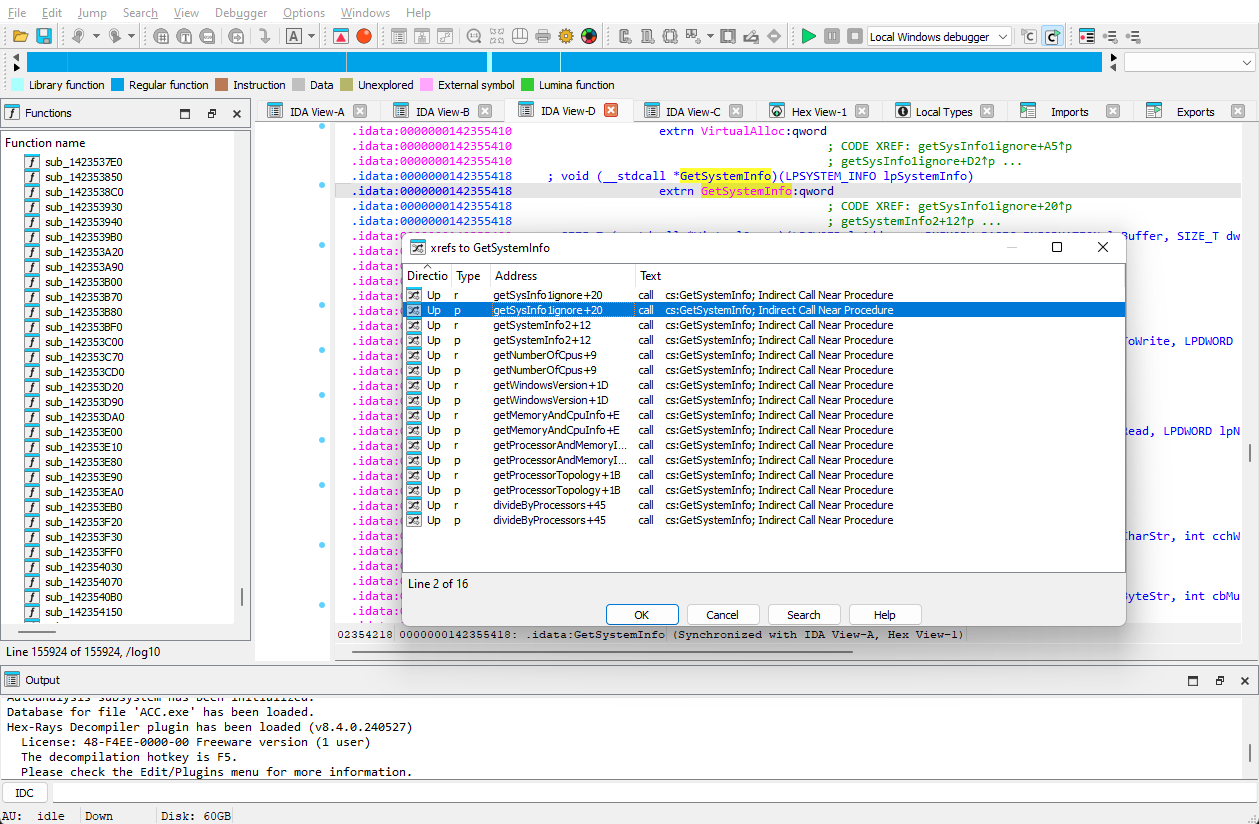
The next step is to disassemble the game so that we can find the places where it might be trying to find out the number of CPUs. For this I used IDA Freeware. While the disassembly is quick, the analysis happens in the background and takes a little while. Once analysis was done, I looked at the Imports and found the GetSystemInfo function. There were several cross-references to places that were calling it (I took the liberty of renaming the functions based on a cursory glance of what they were doing):


Let's take a look at the second entry, the one that I renamed to getSystemInfo2. I was really impressed with IDA here: it understands Windows API structures and was able to figure out how members of the structures were being used:

Note that dwNumberOfProcessors is read into the edx register here and stored in various locations. Instead of reading the value from the structure, I want to lie to the game: I want it to see a hard-coded value of 8 CPUs. So now I need to change the bytes (8B 54 24 50) which is the machine code for "mov edx, [rsp+68h+SystemInfo.dwNumberOfProcessors]" to... something else. Something that just gives me the value of 8 in edx. Unfortunately the free version of IDA doesn't do assembling, so I can't write new code here and expect IDA to build me a new executable.

Instead, we're going to do it the hard way: I need to figure out how to get the value of 8 into edx but in 4 bytes or less. Since IDA won't help me out here, I'll use an online assembler to try some things, and then a hex editor to change the actual bytes.

Well, let's try the obvious instruction: "mov edx, 8"

Unfortunately this results in 5 bytes (ba 08 00 00 00), which is difficult to stuff into 4 bytes. What's interesting is that the full immediate 32-bit value representing "8" is present in the machine code, which makes some sense since we're writing to a 32-bit register.

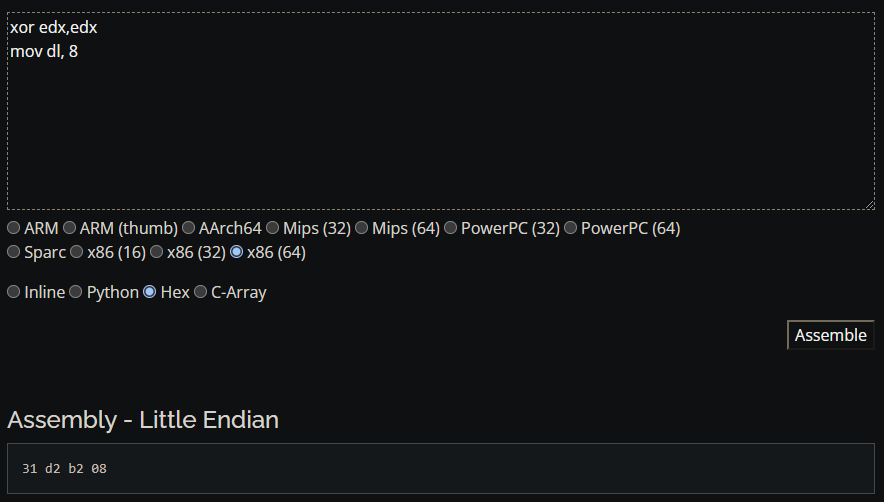
This gave me an idea. What is the machine code to move 8 into the lowest byte of edx (the dl register)? Turns out this is only 2 bytes (b2 08)! The problem is that the other 24 bits of our edx register are garbage. Maybe we can clear the register with an xor (exclusive-or) instruction? If you xor a register against itself the value is always 0. Let's try that: xor edx, edx--this produced machine code (31 d2).

Perfect, so we have our solution:

Then I'll just use my trusty hex editor plugin for VSCode to search for the preceding bytes and write over the old bytes:

We just need to apply this to each location in our cross-reference list above.

Working through the list, we run into a problem with the function that I've called "getMemoryAndCpuInfo". The dwNumberOfProcessors value is written to a different register: r11d. This is an extended register for 64-bit processors and needs 5 machine code bits to read the value into it.

Unfortunately, our trick isn't working here. Assembling "xor r11d,r11d; mov r11b, 8" takes 6 bytes.

Let's try a different approach: push and pop the value, which uses the stack. We really don't want to make any stack changes as moving the stack pointer will cause issues with all of the following instructions that read/write from the stack. But if we immediately reset the stack pointer by popping the value, it should be fine. So let's try that:

Perfect! The push/pop is only 4 instruction bytes, so we had to add a "nop" or no-operation instruction (only one byte) to bring us up to our total of 5.

Our next wrinkle happens in the function that I've dubbed getProcessorTopology. While this function is also calling GetSystemInfo and using dwNumberOfProcessors (easily patched by our previous methods), it's also doing something further:

It's checking to see if Windows is new enough to have a function GetLogicalProcessorInformation and calling it if it does. We don't really want the game to call this function since it ruins our lie about the number of processors. Fortunately, this function is smart enough to handle the situation where that function doesn't exist. So to prevent it from calling this function, we'll just change the name to all X's. It will attempt to find a function called XXXXXX... which obviously doesn't exist. IDA can also confirm for us that this is the only location where that string is used, so we can safely change the name.

Unfortunately we're not out of the woods yet. There is one more function, and it's a doozy:

This function is doing a signed integer divide by the number of processors. None of our tricks thus far will work for this. Let's take a deeper look at what this instruction is doing. It takes a 64-bit value with the most significant 32 bits in edx and the least significant 32 bits in eax and divides by a 32-bit value (in this case, our dwNumberOfProcessors)--eax will receive the quotient and edx will contain the remainder. It does this in only 4 bytes!

However, it doesn't appear to be using the quotient at all, just the remainder. So this is actually doing a modulus by the number of processors. So what we need to do is actually a modulus by our lie of 8 processors. Can we do it in 4 bytes!?

Well, we have a few things going for us. The original function does a cdq (convert doubleword to quadword) instruction to set up for the divide, it also needs eax and edx for the divide but only edx with the result. And since we've chosen a magic power-of-two value of 8, we can achieve a modulus by doing an AND operation with (8 - 1) or 7.

Within reason, we can also move some instructions around as long as the side-effects are the same.

All we really need to do is this, which is only 5 bytes:

And we've already established that we don't need the cdq instruction since that was part of the divide. So cdq + idiv gives us 5 bytes! All we need to do is move the "mov r8, rbx" one byte earlier then we have the 5 bytes that we need together!

That's all the locations calling GetSystemInfo patched up. The question is, does it run?

I fired up the game, and it purrs along like a charm! No more stalls. Seems like the theory of my computer having too many CPUs for an older game trying to take advantage of them was accurate.

I've uploaded the patched executable to Nexus Mods but as of this writing there haven't been any downloads. I guess not many people are trying to play a 10-year-old game with 64+ CPUs! At least I'm enjoying it again 😉


06 July 2024

Fixing a Memory Corruption bug in Python

For Omniverse we use Python for scripting. About a year and a half ago, we upgraded from Python 3.7 to Python 3.10. Shortly thereafter, we started seeing occasional memory corruption issues crop up, but it took a while to actually link the cause to Python.

A lot of the crashes that we were seeing involved very deep and complex Python stack traces in seemingly innocuous things: the garbage collector, releasing a reference, sometimes allocating new memory within Python. Since my team in the Omniverse group handles the plugin system, we manage the plugin that embeds Python into Omniverse, which means I was assigned all of these crashes for triage.

We do have some internal Python experts, and my team wasn't the tip of the spear on the 3.7 -> 3.10 upgrade (though we were involved). The nature of memory corruption means that crashes can happen in very random ways, since any call to acquire or free memory (which happens a LOT) may trigger a crash. So we had 20+ different stack traces that were considered to be part of the same memory corruption pathology. Curiously, this was only happening on Windows, and another clue was that quite often we would see an error in the log sometimes well before the crash occurred:

RuntimeError: <_overlapped.Overlapped object at 0xXXXXXXXXXXXXXXXX> still has pending operation at deallocation, the process may crash.

"Helpful!" I thought to myself sarcastically. Well, the process was in fact crashing, so this may be an indication as to what happening.

However, this crash was fairly low priority. It wasn't happening often per se, but it was annoying. I made a task to track all of the different automatically generated crash stack traces, and periodically tried to find someone who could look into it. Since it was Windows-only and rare, it never percolated up to the top of anyone's priority queue.

Months passed and I continued to be irritated when another new stack trace would pop up. Everyone, including me, was busier with higher priority tasks. Since no one else could be bothered to fix it, I eventually decided to take a crack at it.


"Overlapped" I/O?

Typically when you're writing a program and you want to do a network request, or reading a file, or any other sort of input/output the easiest thing to do is to stop everything and wait because you need the results before continuing. But in the world of 60+ FPS, stopping and waiting for even a few milliseconds can feel sluggish. We instead want to do things a-synchronously--have them happen in a background process and the program can do other things while waiting. One way of doing this is through parallelization, that is, using a separate thread or CPU to do work, but this can also be messy. Also, Windows is old and computers used to just have one CPU, so a long time ago Windows started doing a-synchronicity through concurrency and the Operating System would handle interleaving all of the requests. "Overlapped" I/O is how Windows started doing that: multiple I/O operations could be done at a time, hence they overlap each other.

The problem is, it's pretty complicated. And even more so in an environment like Python where implementation requires both C code and Python code.


Reproducing the problem

The first step was to try to reduce the problem to a minimum so that it was easier to debug. I also knew that we started having this problem when we moved from Python 3.7 to 3.10, so I looked at the changes to see what might be different. I noticed this in the "what's new in Python 3.8" article:
On Windows, the default event loop is now ProactorEventLoop. (Contributed by Victor Stinner in bpo-34687.)

It turns out that Windows and Linux asyncio event loops are implemented quite differently, which makes sense because Asynchronous IO works quite differently on Windows and Linux. With Python 3.8, asyncio now used Overlapped IO by default through the Proactor event loop.

Omniverse was also doing something different from most Python applications: constantly stopping and re-starting the event loop. See, in most Python applications the program hands control to asyncio until the program finishes; asyncio then dispatches everything that the application does. Since Omniverse uses embedded Python, we still have a graphical application that needs to run, so each frame of the graphical application we would just run the asyncio event loop for one "tick" and then stop it.

I wrote a simple app that emulated that behavior, but I couldn't get it to crash, so that wasn't enough to do it. We had a sample case that could produce the Overlapped error message typically within 5 minutes (which is an eternity when you're waiting for it), so I looked at what it was doing. After much debugging I found another clue: other threads were calling call_soon_threadsafe on the event loop. I added that to my test program. BINGO. This program had an 80% chance to print the error message within 60 seconds:

This program starts a thread that pings away scheduling a dummy function to run on the next loop iteration. It's real purpose is to send a wakeup signal to the event loop. The main thread just constantly does our stop/run idiom like Omniverse does so it doesn't have to hand control to the event loop permanently.


But does it corrupt memory?

The error message comes from the implementation of _overlapped, which is done in C and acts as a bridge between Python code for the asyncio event loop and the Windows API call to manage overlapped I/O. Let's look at what happens before that.

When the run_forever call is cleaning up it tries to cancel the "_self_reading_future":

Which in turn calls into the C code for _overlapped and invokes a Windows API function called CancelIoEx:


Then the run_forever function unregisters the 'overlapped' object (ov) and sets the future to None, effectively destroying the object.

This is where the danger arises! The overlapped structure (managed by the overlapped Python object) has been passed to the Windows API when an IO operation was requested (in this case it's for the socketpair used to notify the event loop for other threads) and cannot be deallocated until Windows reports that it's done with it!

The deallocation function attempts to check this, and reports the error message if Windows isn't done with it. But then goes on to deallocate the structure anyways, which can lead to memory corruption!


While not ideal, a better alternative might be to report the error and leak the OVERLAPPED structure so that a crash won't occur. But the best alternative is to see if we can fix the problem.

With a reproducible case and an understanding of what was going on, I filed a Python issue.


Can we fix it?

I put the initial diagnosis into the Python issue: CancelIoEx is being properly called, returns TRUE meaning that Windows requested the cancellation (NOT that it was cancelled yet!), but the deallocation function sees that the overlapped I/O hasn't yet completed. It tries to call CancelIoEx again (this always fails with ERROR_NOT_FOUND since the previous cancel request succeeded), and then calls GetOverlappedResult (note that wait=false because the second CancelIoEx attempt fails), which will also fail with ERROR_IO_PENDING. As a test I tried changing it to wait, but this just caused a hang.

What gives? Originally I though this was a bug in Windows and handling Overlapped I/O, but then I tried something else. Not only is this system using Overlapped I/O, it's using another complex Windows-ism: I/O Completion Ports. This system is a way to group multiple I/O requests together, so that instead of having to check myriad different requests, you check one "completion port" to find out when any of your requests finish. What if the cancelled I/O request is stuck in the I/O completion port? Instead of waiting on GetOverlappedResult, maybe I need to read the request from GetQueuedCompletionStatus.

BINGO.

Turns out that was the case: it really depends on where within the labyrinthine Windows I/O ecosystem the I/O request ended up before the cancel request happened.

So now we could make an "official" fix recommendation. Generally large projects like Python desire fix recommendations from outsiders like me to be as simple and elegant as possible. Which meant that I would have better luck without completely trying to change how their Overlapped I/O worked. Since all we needed to do was make sure that GetQueuedCompletionStatus was called on our _overlapped object again, that gave us a goal. GetQueuedCompletionStatus was actually called every time the event loop ran, and it already cleaned up finished _overlapped objects once they completed. All we need to do is only allow cleanup after canceling if the I/O was complete, otherwise it would get cleaned up automatically during the next event loop iteration.

So that just meant changing the line


to


Done and dusted!

Of course, for the official fix I added a unit test and a bunch of comments since Overlapped I/O and I/O Completion Ports are frustratingly touchy.

As a bonus, Guido van Rossum (creator of Python) commented positively on the fix, and eventually we got the fix merged back as far as Python 3.8--the oldest supported version (for security fixes), but also the first version where the ProactorEventLoop became the default.

05 June 2024

Basic Callback Hygiene

There's a tenet that I've been pushing on for a few years now from my little corner of NVIDIA, and that is the concept of Basic Callback Hygiene.

For the uninitiated, a callback simply-put is a function that I can pass to another function that it will later call to "call me back." A lot of subscription services in programming work like this: Something is going to happen in the future. I want to be notified of it, so I'll call a subscription function and give it a function that it can call to tell me when that happens.

This simple concept gets a lot more complicated when you ask what sorts of things you can do within that callback function. What happens when I don't care about the subscription anymore? What if the module containing the function unloads? What thread is the callback going to happen on? And so on, and so forth.

I've experienced problems with all of these complications over the course of my career, and given the amount of asynchronous and modular code that I've been writing for Omniverse, I finally distilled down a simple set of rules:

  1. Callbacks can ask to be unregistered from within the callback.
  2. Strong recommendation to not hold locks (i.e. a mutex) while calling callbacks.
  3. When a callback asks to be unregistered, there must be a strong guarantee that the callback is not currently being called, nor will ever be called in the future.
That's it. A subscription system that follows these basic principles will avoid 99% of the issues that we typically run into with callbacks.

Let's examine each of these. To put this in practical terms, let's say that we're designing an event system. We can subscribe to an event which will register our callback and we can dispatch an event which will callback all of the subscribers from the context of the dispatching thread (so basically it loops over all subscribers and calls their callback). Our imaginary system is thread-safe, so we can subscribe or dispatch from any thread. We can also unsubscribe to unregister our subscription.


Unregistration from within a callback

This is probably the most useful one. Let's consider the case where I cannot unsubscribe from the callback but I want to. My callback is called and I can handle the event, but I cannot unsubscribe. This particular callback only wants to receive the first event after registration and no more events (an example of this might be a one-shot function that I want to defer until the next frame).

Since I cannot unsubscribe, I must be able to conditionally have a function run later that will then unsubscribe my function outside of the event, and I need to ignore any more events that I might receive in the meantime.

This makes something that should be simple much more troublesome, and every place that I want to do this sort of action now requires more thought, effort, time, testing, etc. Changing the system to allow un-subscription from within the callback means that the complexity of handling that situation is in a singular place: my event system, rather than each and every callback that needs that behavior.


Don't Hold Locks

Holding a lock while calling a callback is dangerous because the callback can execute arbitrary code. The callback may call back into our event system and we don't want the complication of having recursive locks (which are arguably evil) or contributing to lock cycles which can cause deadlocks.

Writing an event system to be thread-safe and yet not hold any locks while calling callbacks is challenging to say the least. Generally this requires something akin to tracking the number of threads that are in the middle of doing callbacks, at a minimum. We typically do it by adding a thread identifier to a list while holding a lock, and then unlocking to call the callback, then re-acquiring the lock and removing the thread identifier from the list. This is more complicated to be sure, and the reason why will be evident in the next section. There are other ways to do it, but you'll need some tracking to maintain state while the mutex is unlocked for the callback.

This also means that how you walk the list of subscriptions must be stateful in a way that can resume after the mutex is unlocked and re-acquired. If these subscriptions are stored in C++'s std::vector for instance, there exists a possibility that unlocking the mutex will allow another thread to subscribe, which may resize and therefore reallocate the vector, which invalidates all iterators; or another thread may unsubscribe which will remove an entry, which can affect the position of the current thread walking over the vector. (Solutions to these, respectively, might involve using indexes instead of iterators, and leaving null pointers in the array to mark empty spaces).


Strong Unregistration Guarantees

This is by far the hardest issue to solve correctly. Here's a real-world scenario: right before a module unloads (in the main thread, say), it tells our Event system to unsubscribe a previously-subscribed callback. Without a strong guarantee, what will happen if another thread is currently calling our subscribed callback? As noted above, we don't want to be holding locks while calling callbacks, so waiting on a lock isn't going to wait for our callback to finish. What has happened in actual code is that the unsubscribe happens quickly, the module proceeds to unload, and then a crash occurs because another thread was still executing a function that was in the module. Or after unloading, objects were destructed since we would no longer get events, but with another thread in our callback function, a crash occurs because deleted memory was accessed.

Or the problem that I'm fixing right now: memory corruption occurs because a dependent structure was freed, but a race with the callback means that we were still changing things inside the structure.

It quickly becomes apparent that any request to unregister must wait for any other calls to finish. Also, once we return from the unregister function, it stands to reason that we cannot ever call the callback again. To do so would be violating the caller's unregistration request.

This then requires a strong ordering guarantee:
  1. Unregister function is called.
    1. WAIT for any calls to the callback in question to finish*.
    2. PREVENT any future calls to the callback.
  2. Return from the unregister function. At this point the caller can guarantee that our event system is free of the callback and it is safe to destroy structures.
"Ah," the astute and observant amongst you might notice, "what if the unregistration is from within the callback?!" This was our first point, above. If we WAIT for any calls to the callback to finish and the unregistration call is coming from the callback, we would wait forever. So we amend the line with the asterisk (*) above instead to say: "WAIT for any calls to the callback in question in other threads to finish."

So our subscription process is pretty simple:
  1. Take the lock
  2. Append our subscription information to the std::vector (or similar)
  3. Unlock the lock
The notification process is a bit more complicated as it has to synchronize with the unsubscribe process:
  1. Take the lock
  2. Iterate over the std::vector (or similar) by index, skipping null entries. For each:
    1. Add the current thread identifier to a list of threads that are notifying.
    2. Unlock the lock
    3. Call the callback function
    4. Re-acquire the lock. At this point, the vector may have been reallocated and grown, and subsequent entries may have been unregistered. Any other thread could have done anything.
    5. Remove our current thread identifier from the list of threads that are notifying.
    6. Is a waiting flag set on the subscription? If so, notify the waiting thread (i.e. using a condition variable).
  3. Unlock the lock
And now, the pièce de résistance: the unsubscribe process:
  1. Take the lock
  2. Find the subscription to remove. If not found, unlock and return; otherwise:
  3. Set the entry in the std::vector to null, but it is not destroyed yet!
  4. Is the subscription currently being notified by a thread other than the current thread? If so, set a waiting flag on the subscription that is used in 2.6 above.
  5. Unlock the lock.
  6. If the waiting flag was set, wait on the condition variable for notification from 2.6 above. Otherwise it is safe to destroy the subscription and return.
  7. Re-acquire the lock.
  8. If the list of notifying threads contains threads besides the current thread go to step 5.
  9. Unlock the lock. It is now safe to destroy the subscription.
This will allow our unsubscribe to wait until no threads are notifying our subscription, or only our thread that is currently unsubscribing during notification.

Of course, there is a lot more nuance to this, especially when it comes to handling recursion (dispatching within a callback) or even just the complexity of working with multiple threads, but this should help you understand the concept of Basic Callback Hygiene.

04 July 2017

Resolute Timers

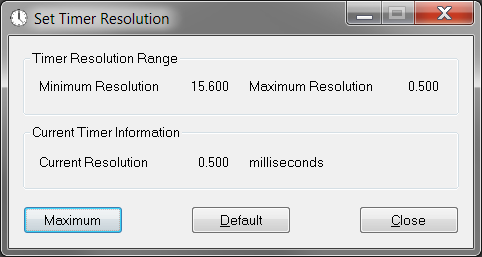
This weekend I got linked into a tweetstorm regarding a tool called Set Timer Resolution by one Lucas Hale. People are claiming that using this tool results in better hit accuracy, faster responsiveness and higher frame-rates for King of the Kill and other Daybreak titles.
Seen here, in all its majesty
It looks like other people have said that this helps, and at one point it looks like the download link was removed from the site. At the time of this writing, Download 3K is apparently a valid mirror (MD5: 4b3bccdb3bcbd48162aa77270d910276). I cannot recommend using any specific third-party applications, including this one. Your mileage may vary and incorrect use of software may cause issues.

This specific very simple app (only 32k in size!) does not affect the game in any way shape or form. In fact, it was originally authored back in 2007, way before King of the Kill. Instead, it tells Windows to check it's timers more often. That's it.

Imagine this. You need to do something in 30 seconds, but you only have a clock with a minute hand. You glance at the clock and it says 4:59 pm. Once it changes to 5:00 pm, has 30 seconds elapsed? Not necessarily! What if you glanced at the clock a mere second before it changed? To ensure that a full 30 seconds has elapsed you would actually have to wait until 5:01 pm to guarantee that at least 30 seconds has passed, but up to 1 minute 59 seconds could have passed!

This is the nature of resolution: how often you can check the clock and it will tell you a different value. Now, computers do things a LOT faster than even once a second. Computers can do things in the nanosecond range (1/1,000,000,000 of a second) or even faster! When I started up the Windows 10 machine that I'm writing this post with, the resolution was 15.625 milliseconds (~0.015 sec). That's WAY slower than 0.000000001 sec! In fact, that resolution will only check the clock 64 times per second, which can be slower than some frame rates that people get when playing King of the Kill.

When we do windows programming, when we set a timer or tell a thread to sleep, we specify values in milliseconds (1/1,000 sec), but if it's only checking the clock every 15.625 milliseconds, a 1 millisecond timer can end up waiting 15.625 milliseconds, which is more than a whole frame in some cases. Obviously we want Windows to check the clock much faster than 15.625 milliseconds.
This is about how often I check my phone. And I always forget to check the time.

Yes but does it WORK?

At first I thought this tool might have some confirmation bias behind it, but after digging into it, i'm going to say that it's plausible that it has a positive effect on gameplay. Windows has but one internal timer, and it's shared by everything running on the system. When Daybreak titles start up, we tell Windows that we want 1 millisecond resolution on the system timer. But, to be good software citizens, we tell Windows to set the timer resolution back to what it was when the game is ending. Seems reasonable, right?

Now imagine that everything does that. Say you start up Some App(tm) that sets the timer resolution from 15 ms to 1 ms, then you start up King of the Kill that also tries to set it to 1 ms. However, then you shut down Some App. Thinking that it's a good software citizen also, it sets the timer back to 15 ms. But you're still playing King of the Kill! Now you might see some different behaviors, like getting micro-stutters, and miss hits that should have landed, etc. The game is doing what it's supposed to, but something happened that it didn't expect: the system timer got set back to low resolution. The Set Resolution Timer tool doesn't appear to continually update the Current Resolution display, but I believe it will try periodically to make sure the system timer is at the selected resolution. EDIT: Lucas Hale (the author of SetTimerResolution) commented below to let me know that this assumption is invalid. It appears that Windows will take the maximum resolution requested by any running application. So if the game client requests 1ms resolution, and SetTimerResolution requests 0.5ms resolution, it will take the latter. This is good as it makes the devs' lives easier!

How does Set Timer Resolution work?

This section is not for the technically faint-at-heart. I'm going to wax programmatically on you. First of all, when the game starts up, we call a documented function called timeBeginPeriod with the minimum value reported by the timeGetDevCaps function (generally 1 [millisecond]). This would probably work fine in many cases as long as our game is the only thing running on the machine. But that is never the case. Little programs that do behind-the-scenes things can start and end and do all sorts of stuff. Browsers can be running with multiple tabs open. Streamer software. Video recording software. Etc. If any of those things can affect the system timer while the game is running, then bad things happen.

It looks like Set Timer Resolution goes even deeper than the multimedia functions (like timeBeginPeriod) that our titles are calling. It goes straight to the kernel, the heart of every operating system. It looks like it's calling some undocumented user-mode kernel functions: NtQueryTimerResolution and NtSetTimerResolution. These are likely called deeper down from the multimedia functions that our titles use.

So where do we go from here?

I'd like to make Set Timer Resolution completely unnecessary. Since the game is already trying to set the timer resolution at startup, it seems like we could be doing a better job of making sure it stays set. I'll evaluate this against our current priorities and talk with the team about getting this in an upcoming hotfix.
Boom.

20 February 2017

Which patch? Dispatch.

**Authors note: I started writing this post a year ago. Hence the references are a bit dated, but the content is relevant.

At the behest of the good people of reddit, I figured I would talk a little bit about a recent issue that cropped up in Planetside 2: a runaway thread in our threading library that went mostly unnoticed and caused reduced performance.

Threads Are Hard

Writing good multi-threaded code isn't easy. I challenge the linked article's author in that multi-threaded programming is actually difficult. Sure, some of it boils down to programmers not following best practices, but there are several other facets that you don't encounter in single-threaded programming:
  • Synchronization
    • Reads and Writes to data must be synchronized
    • Compiler's optimization effect may subtly effect program operation
    • Lock-less programming considerations
    • Possibility of dead-locking or live-locking
  • Non-determinism. This basically means that the program doesn't run the same way every time. This has several repercussions:
    • Difficult-to-reproduce issues
    • Testing/error logging can mask issues or create false positives (similar to the Observer effect)
    • Statistical testing (problems occurring with a low enough frequency that you don't see them until they reach the Live environment)
Woody shares my expression.
However, the availability of hardware is favoring power by having increasingly larger numbers of cores. To take advantage of that power, you need threads.

Concurrency

Threads are a solution to the problem of trying to make a computer seem to do multiple things at the same time. In the olden days, threads didn't exist, but systems could start other processes by forking the process. This would create a copy of the process that could do different things without affecting the parent process. By being a copy, changes that one process made to its memory and variables wouldn't affect the other process. The two processes would still be able to communicate somewhat via IPC, but this is generally much slower than, say, setting a variable within a process.

Like my threads?
But sometimes you want one process to be able to do multiple things at the same time. That's where threads come in to play. Since threads allow multiple things to happen "simultaneously" within the same process, you have concurrency. 

I put "simultaneously" in quotes, because multi-processor systems of yore were generally limited to server-class hardware. It was uncommon to find a user's home machine with more than one processor. This means that the system could really only do one thing at a time, but it looked like it was doing things simultaneously because it was switching threads (i.e. things that it was doing) very, very quickly. These days, everything is multi-processor. My house thermostat is probably multi-CPU (ok, not really). The focus in hardware shifted from doing one thing very fast (higher clock speed aka GHz on CPUs) to doing many things pretty fast at the same time. The previous generation consoles (Playstation 3 and Xbox 360) had three to four CPUs whereas today's console generation (PlayStation 4 and Xbox One) have eight. My work computer has 12 "logical" cores.

Early threading involved creating threads for very specific tasks. For example, EverQuest II largely runs in a single thread, but creates specific threads for loading files, talking to the streaming asset server, updating particle effects, etc. Most of the time those specific threads are doing nothing; they're just sleeping. As the number of processors in a system grew, it becomes less practical to have dedicated, specific threads, especially when the number of processors in a system differs from system to system.

Synchronization

Let's take a break for a second to talk about a related topic. Synchronization is a big, huge, gargantuan topic wherein lies most of the problems with multi-threading. I'm only going to say a few words about Synchronization.
Yep, like that.
Nearly everything in the computer system can be considered a resource that must be shared: files, memory, CPU time, DVD drives, graphics, etc. What must be shared must be synchronized so that separate threads don't counter-productively stomp on each other. Process memory is probably the most often shared and problematic resource because everything interacts with it. Something like a file is fairly easy to synchronize because nearly every access of it requires a function call. Memory, on the other hand... For instance, here is an example of a function that just increments a number. What would the value be if you had two threads on a multi-processor machine calling this function 1000 times?


Hint: it's usually not 2000. Surprise! Incrementing a number is not an atomic operation, it's actually a read-modify-write operation. This is one of those things that makes multi-threaded programming so hard! To protect the section of code that increments the number, you have to use some sort of synchronization primitive, like an atomic intrinsic, mutex, spin-lock, or the like.

Tasking

When you have more processors available, it makes more sense to break problems down in to logical tasks or units of work. Instead of having a dedicated thread to load files, now you just have a "load file" task. You have a "collect garbage" task. You have an "animate entity" task. Task, task, task.

Khaaaaaaaannn!!!

This concept of tasks helps you to fill all available processors with work to do. Theoretically, if you can keep the task backlog full, CPUs will always have work to do. If you're using 100% of the available processors, you're doing the maximum amount of work that the system can do.

Dispatch

In 2009, Apple launched Mac OS X 10.6 with a programming API (libdispatch) marketed with the name Grand Central Dispatch (GCD). It is, among other things, a generic task execution system. You have a function or a task that you want to run in the main thread or a separate thread at specific priority levels, immediately or at a scheduled time in the future. You just take that function or task and throw it on a "dispatch queue" and let it run. Simple. Powerful. Efficient. I quickly fell in love with what GCD could offer when I used it for my iPhone game, Bust a Mine.

Fast forward to mid-2014. I became Technical Director of Planetside 2. The team was working on porting Planetside 2 to the PlayStation 4. Performance profiling was showing that the CPUs on the PS4 were slower than average CPUs on our PC players' machines, and Planetside 2 was still largely single-threaded. We started looking at threading technologies like Intel's Threading Building BlocksOpenMP, and even the C++11 thread support library. However, given my experience with libdispatch and the approach of looking at the problem as tasks rather than dedicated threads, we decided to look around for something similar. We found xdispatch, a port of libdispatch to Windows and Linux (libdispatch was originally written for Mac OS X which is based on BSD). However, it had some issues: namely it didn't support the PS4 (few things did) and was based on a much older version of libdispatch. We began adapting it to the PS4 and it gave us a solid framework to start multi-threading Planetside 2.

Adaptive Tuning

We developed a threading sub-team on the PS4-on-PS2 project that had a primary requirement (increase performance) through two primary points of attack: 1) tune xdispatch to do what we needed and 2) adapt existing threads and operations into tasks that could be done concurrently. Ideally these changes would carry over to the PC version of the game as well.

Both of these facets were challenging. On the tuning front we discovered that part of the reason that GCD works so well on Mac OS X is because the kernel--the core of the operating system itself--is controlling the dispatch scheduling. We didn't have that ability on the PS4, nor could we get the information about how busy the system is! We went several iterations on how to deal with this, but eventually settled on working around this by setting up some guidelines--the standard dispatch queues would only be used for CPU-intensive work (calculation, animation, decompression, etc.) and we would limit them to the number of CPUs available.

The second facet was a much longer pole that would continue throughout the project. Converting existing dedicated threads and PS2's old job-queue system to Dispatch was easy and quickly done, but that didn't net nearly the performance that we would need to see to be viable on PS4. We would have to go much deeper. This would involve taking core aspects of PS2's main loop and breaking them into tasks--entity processing, physics, animation, rendering, etc. This is difficult to do with C++ because non-thread-safe side-effects are nearly impossible to find; we would have to identify everything non-thread-safe that was happening in the single-threaded code before converting it to tasks.

OMG Bugs

That was the song, right?

The reddit post that originally spawned this blog post sheds some insight on to a problem that still existed a year after the PS4 version originally launched. Namely, PC players identified that a thread would take a whole CPU, but they found that if they killed it, performance got better and nothing bad really happened (or was not immediately visible). This was found to be a bug in timers in xdispatch that, to my knowledge, still exists. You can read the above link for more technical information, but it had to do with bad assumptions in the PC port of software originally written for BSD. Shockingly, the problem also existed in the PS4 build even though it shouldn't have. It looks like the timer implementation in xdispatch (and the libdispatch version that it was based on) was functional but not very efficient, so we wrote a new timer outside of xdispatch and used that instead.

Still later, we finally got a handle on one of our long-standing (post-PS4-launch) crash bugs. This was a crash bug that we had never seen internally (see my above point about bugs becoming a statistical problem). It looked like a memory corruption problem, which just made all of the programmers reading this shudder in horror. Memory corruption is terrible. It is an evil problem and few good tools exist to locate it assuming you can figure out how to make it happen. But find it we did, and it was also an issue with converting systems to multi-threading. In this case, an 'animation complete' flag was in a data structure that was getting freed before the task performing the operation finished and set the flag. Since the memory was freed before the flag was set, sometimes the memory had been reused for other things, hence the corruption. This was a problem not with Dispatch itself, but with how a previously single-threaded operation had been converted to a task.

Most recently, we began hearing reports of 'lock-ups' and 'hangs' from PS4 players. This coincided with an update to PS4 SDK 3.500 (from 2.000) for Planetside 2, which, among other things, gave us an additional half of a CPU to use for game logic (with 2.000 the system would reserve two whole CPUs for itself, whereas after 3.000 it only used one-and-a-half). Because of this, we ramped up Dispatch (now a completely retooled version no longer based at all on xdispatch but based on a more current version of libdispatch) to take advantage of that half-a-CPU. Eventually we determined this to be the cause of the lockup, but for unexpected reasons. The game was not experiencing a dead-lock, but a form of live-lock; all of the CPUs were running threads, they just weren't making any progress. This was because of a degenerate case between the design of libdispatch and the PS4 scheduler. Basically, the internals of libdispatch (and our Dispatch library that was based on it) are lock-less--they are doing atomic operations rather than locking mutexes. Some of these atomic operations are loops waiting for conditions to be met, or multiple compare-and-exchange operations in a loop; they try to do an operation based on old information and retry with updated information if it fails. But the PS4 scheduler will not run any thread of a lower priority if a higher priority thread is runnable. We could end up in a state where a lower-priority thread would be preempted after it changed conditions for a higher-priority thread. This would cause a sort of priority inversion that would never resolve. Most operating systems will at least give some time to lower priority threads to prevent starvation, but the PS4 does not. Indeed the default scheduler for the PS4 is the FIFO scheduler, but even the round-robin scheduler will not run lower-priority threads. Our solution to this involved applying a progressive algorithm that would eventually put threads to sleep in extreme cases in order to allow the live-lock to resolve. Generally this might look like a slight momentary dip in frame rate or may not even be noticed at all.

Looking Forward

Make sure your blinker is on.

We're always looking for ways to increase performance across all platforms. As other Daybreak games ramp up we're finding new ways to eke out increasing frame-rates and sharing that knowledge among the teams. Our internal Dispatch implementation is moving into other Daybreak titles and future projects, and it all started here, on Planetside 2. Efforts have been made to keep these types of changes in parity between the different games.